A breakout occurs when the stock price moves with greater volume outside of a designated support or resistance level. When the stock price breaks above resistance or below support, a breakout trader opens a long position or opens a short position.
Prices often trend in the direction of the breakout once the stock trades above the price barrier, with volatility tending to rise. Breakouts are a crucial part of trading strategies because they often signal the beginning of significant market trends, substantial price swings, and future spikes in volatility.
All kinds of market settings can experience breakouts. Channel breakouts and price pattern breakouts, such as triangles, flags, or head and shoulders patterns, usually result in the most dramatic price moves. During these periods, volatility diminishes and then usually expands once prices move outside of the designated ranges.
A wonderful approach is breakout trading, regardless of the timeframe. The principles apply regardless of whether you use intraday, daily, or weekly charts. This approach can be used for swing trading, day trading, or any other type of trading.
The support and resistance levels of the underlying stock should be taken into account while trading breakouts. These levels gain validity and significance as the number of times a stock price touches them increases. However, the longer these levels of support and resistance remain in place, the more favourable the result will be when the stock price does eventually break out.
On the price chart, different price patterns will emerge when prices consolidate. Channels, triangles, and flags are useful formations to use when searching for stocks to trade. When looking for a suitable candidate to trade, it’s crucial to take into account elements like consistency and the amount of time a stock price has stuck to its support or resistance levels, in addition to patterns.
Fixed exit points are a necessary component of a profitable trading strategy. There are three things to set up before opening a position when trading breakouts.
1. Where to Exit With a Profit
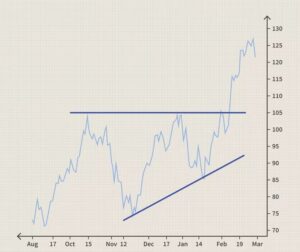
Plan your target pricing based on the stock’s previous performance to establish a fair goal. It’s simple to use recent price action to set a target when trading price patterns.
For instance, if a recent channel or price pattern has a range of six points, that quantity should be used as a price target once the stock breaks out (see below).

To generate a relative price goal, another method is to average the recent price fluctuations. This would be a feasible goal if the stock has made four point price movements on average over the last few price swings.
Here are some suggestions for establishing price objectives as the trade goal. Your objective for the trade need to be this. An investor has three options once the objective is met: they can raise a stop-loss order to lock in profits, exit the entire position, or leave a portion of it to let the remaining piece to run.
2. Where to Exit With a Loss
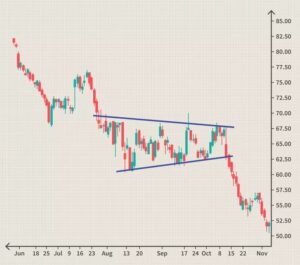
Understanding when a deal has failed is crucial. This is a fairly clear information provided by breakout trading. Old levels of resistance should become new levels of support after a breakout, and old levels of support should become new levels of resistance.
This is a crucial factor to take into account because it provides a methodical approach to identifying when a trade has failed and a simple way to figure out where to place your stop-loss order. Use the previous level of support or resistance as a line in the sand to end a losing trade once a position has been taken. Examine the PCZ chart below.

It’s critical to close a deal as soon as possible when it doesn’t work out. Never allow a loss to get too big. Should you be not careful, losses can accumulate.
3. Where to Set a Stop Order
Consider using the previous level of support or resistance that prices have broken in order to determine whether to exit a position at a loss. Protecting a position safely and limiting the trade’s negative risk can be achieved by securely placing a stop inside these boundaries.
Because prices frequently revisit price levels they have just broken out of, setting a stop higher than this will probably induce an early exit.
The first price consolidation, the breakout, the retest, and the price target met are all visible on the above chart. It’s a really mechanical process.
If the stop-loss order had been placed above the previous resistance level, prices would not have been allowed to retest these levels when determining where to place it. and the investor would have been stopped out prematurely. Setting the stop below this level allows prices to retest and catch the trade quickly if it fails.


Nice
Pingback: Intraday Trading: The Basics and How to Get Started - stockbazzar.com